I wrote the code that powers 3 simple games that (ideally) teach you something about antibiotic resistance as part of a project for Imperial College and World Antimicrobial Awareness Week.

I wrote the code that powers 3 simple games that (ideally) teach you something about antibiotic resistance as part of a project for Imperial College and World Antimicrobial Awareness Week.
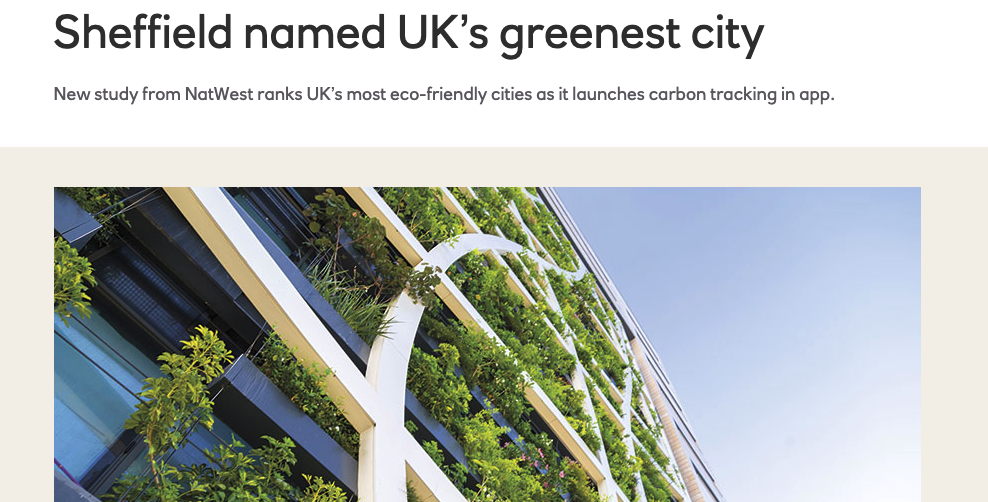
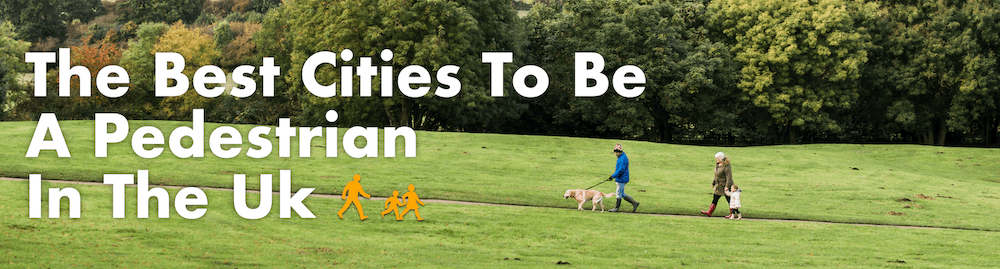
I put together the data behind this report on the UK’s Greenest Cities for NatWest, in collaboration with Professor William Powrie of the University of Southampton.

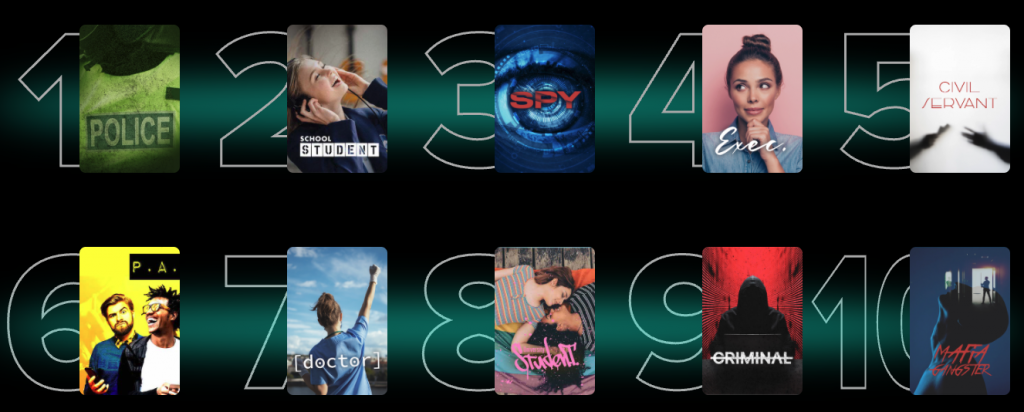
I built and wrote the words for a web game to tie-in with UP:RISE, an Augmented Reality public artwork by artist Baff Akoto concerned with the pathology, history and underlying drivers of English civil unrest in the digital age.
Will you do better than the real people in charge did during the 2011 riots?
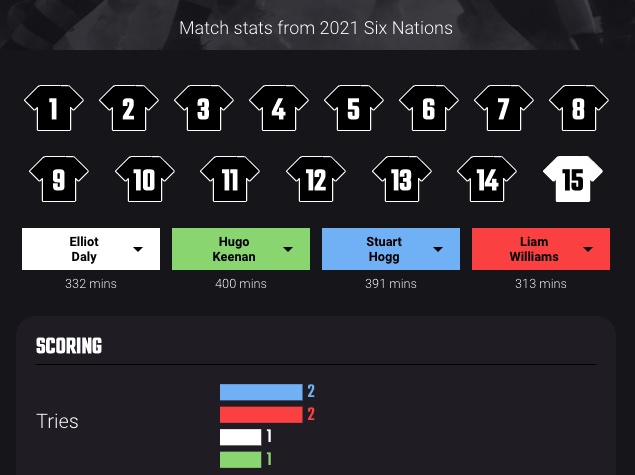
Despite having forgotten what very little I learned about rugby when forced to play it 25 years ago I worked with Mark Johnstone of Content Hubble (who had to explain what all the statistics actually meant) on this interactive piece which compared the players of the different UK teams ahead of the selection for the British Lions tour.

I put together the data behind this piece on the most popular songs on Working From Home Spotify playlists to get an idea of what people were listening to during ‘the new normal’ for office workers.
I researched, wrote and then built the interactive element of this piece for Uswitch comparing loading times for websites across different commercial sectors.

For this piece I used OpenStreetMap data* to generate imagery and maps representing how much land in different cities is set aside as green space compared to how much is used for roads and buildings.
Coverage included: NBC New York, Planetizen, Boston Magazine
* supplemented by other sources where OSM was missing e.g. building footprints

I compiled the data and generated the maps for this piece, visualising US census information about commute times for 20 different cities to show how long different journeys into each city take, and which city’s commuters have it the worst.
Coverage included: NBC San Diego, Curbed, Star Tribune